How to use SQL Nexus
- Install SQL Nexus and RML Utilities
- Collect perf data from your SQL Server instance using SQL LogScout.
- Import and analyze the data using SQL Nexus
- Get the latest version for SQL Nexus on https://github.com/microsoft/SqlNexus/releases
- To install, see Installation page
In order to use SQL Nexus, you will first need to collect diagnostic data. You can use either of the following tools:
- SQL LogScout (recommended) – a modern, lightweight data collection tool for SQL Server on Windows and Linux
SQL Nexus supports importing data from SQL Server 2012 and later, including SQL Server on Linux.
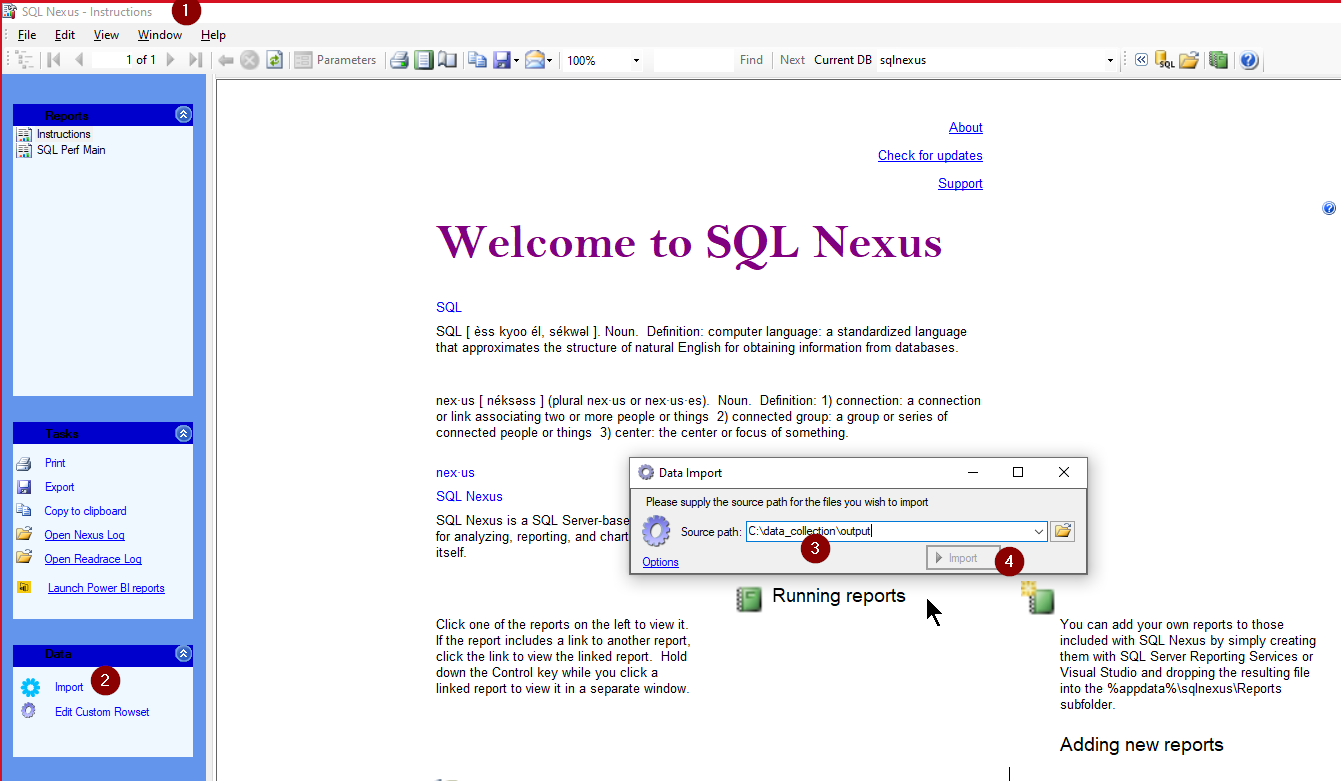
- Launch sqlnexus.exe and log on to a non-production SQL Server instance where you have SQL Nexus installed.
- Click on Import in the left pane of the main SQL Nexus window.
- Provide the folder path where you stored the collected data. Note: provide a directory path, not a file name.
1.SQL Nexus will automatically detect and list the files to import, including:
-
Rowset output files (
.outtext files from SQLDiag/SQL LogScout) -
SQL Trace files (
.trc) — processed via RML Utilities/ReadTrace -
PSSDIAG XEL files (
*pssdiag*.xel) — processed via RML Utilities/ReadTrace -
SQL LogScout XEL files (
*LogScout*.xel, e.g.xevent_LogScout_target*.xel,SQLLogScout_AlwaysOn_Data_Movement*.xel) — processed via RML Utilities/ReadTrace -
SQLDiag XEL files (
*_SQLDIAG*.xel) — auto-generated by SQL Server on Failover Cluster Instances (FCI) and Always On Availability Groups viasp_server_diagnostics -
Always On Health XEL files (
*AlwaysOn_health*.xel) — built-in SQL Server Always On health session -
System Health XEL files (
*system_health*.xel) — built-in SQL Server system health session -
Performance Monitor logs (
.blg) via Perfmon Importer -
SQL Server ERRORLOG files (
*_ERRORLOG*, e.g.SERVERNAME_ERRORLOG,SERVERNAME_ERRORLOG.1) via ERRORLOG Importer - Linux performance data (IO stats, CPU, memory, networking, process
-
Rowset output files (
- Press the Import button.
- Once the import is finished, click on the reports in the left pane. Start with the Bottleneck Analysis report to determine where most query execution time was spent.
When you click the Options button on the Import page, a dropdown menu appears with an Importers submenu. Each importer can be enabled/disabled and fine-tuned there, and your choices can optionally be persisted between sessions.
At a glance:
| Importer | Enabled by default | Handles |
|---|---|---|
| Rowset Importer | ✅ |
*.OUT / *.TXT rowset output |
| Trace Event Importer (Managed) | ✅ |
*.xel — recommended, no RML Utilities needed |
| ReadTrace (SQL XEL/TRC Files) | ❌ |
*.trc and *.xel via RML Utilities |
| ERRORLOG Importer | ✅ |
*_ERRORLOG* → tbl_ERRORLOG
|
| BLG Blaster (Perfmon/Sysmon) | ✅ | *.blg |
| Import Linux Performance Files | ❌ | *.perf |
| Import SQLDiag / AlwaysOn / System Health XEL | ❌ |
*_SQLDIAG*.xel, *AlwaysOn_health*.xel, *system_health*.xel
|
Only one of Trace Event Importer (Managed) or ReadTrace can be enabled at a time — enabling one automatically disables the other.
For the full list of options per importer, how settings are persisted in user.config, and
the /M command-line switch, see Importer Options.
You can use SQLNexus as a command line utility. You can get the following help menu via sqlnexus.exe /? or sqlnexus --help
sqlnexus.exe [ [ /S [ /E | /Uuser /Ppwd ] [/D"database"] ] | [/C"connstr"] ] [/Iinputpath] [/Ooutputpath] [/Rreport] [/X] [/Q] [/N] [/M<importers>]

/S"server"      Specifies a SQL Server name to connect to.
/D"database"    Database to connect to
/E              Log in to SQL using Windows/integrated security
/Uuser          Specifies a SQL (non-Windows) login name
/Ppassword      Specifies the password for a SQL (non-Windows) login
/C"connstring"  Specifies the SqlClient ConnectionString to use (can be used instead of /S /E).
/I"path"        Import SQL diagnostic data from this path
/R"report"      Specifies a report file name to run.
/O"path"        Specifies an export path for reports executed via /R. Also this is where the sqlnexus.000.log would get created
/X              Exit after importing (/I) or exporting (/O) the specified report (/R)
/Vparam=value   Specify the value of a form parameter
/Q              Quiet Mode - minimize windows in console mode
/N              Create a new SQLNexus database before importing (drop existing).
/M<importers>   Enable specific importers for this run (see below).
Switches do not accept a space between the switch and its value —
/Rreportis valid,/R reportis not.
The /M switch controls exactly which importers run for a single command-line import, without
changing any saved UI settings. Tokens are case-insensitive:
TraceEventImporter (aliases Trace, TraceImp, TraceImporter), ReadTrace, Perfmon,
Linux, Errorlog, CustomXEL, and All.
| Form | Meaning | Example |
|---|---|---|
/M<token>[+<token>...] |
Run only the listed importers | /MPerfmon+Errorlog |
/MAll |
Run every wired built-in importer | /MAll |
/MAll-<token>[-<token>...] |
Run everything except the listed importers | /MAll-Trace-Perfmon |
The Rowset Importer always runs, regardless of
/M.+and-cannot be combined in one value, and unknown tokens are rejected.
For the complete token reference, mutual-exclusivity and fallback rules, exit codes, and more examples, see Importer Options.
A. Import data using the local instance and Windows authentication. The default log location is %temp%.
sqlnexus.exe /S"." /E /D"sqlnexus" /I"C:\data_collection\output"
B. Import data using a named SQL Server instance, drop the existing sqlnexus database, write the log to a custom folder, and run quietly without interaction.
sqlnexus.exe /S"sqlmachine\sql2017" /E /D"sqlnexus" /I"C:\data_collection\output" /N /O"c:\temp\" /Q
C. Import only the ERRORLOG and Perfmon data into a brand-new database and exit.
sqlnexus.exe /S"." /E /D"sqlnexus_errorlog" /I"C:\data_collection\output" /N /MErrorlog+Perfmon /X /Q
SQL Nexus ships with a Model Context Protocol (MCP) server (SqlNexus.McpServer.exe) and a
SQL Nexus Diagnostic Agent for GitHub Copilot, so you can ask questions about an imported
SQL Nexus database in plain English instead of clicking through reports or writing T-SQL:
- "Is there high CPU on this system, and which queries are causing it?"
- "Is I/O slow, and is SQL Server the contributing factor?"
- "Compare the slow run and the fast run and tell me what changed."
Minimal configuration (VS Code mcp.json):
{
  "mcpServers": {
    "sqlnexus_MCP": {
      "command": "C:\\path\\to\\SqlNexus\\SqlNexus.McpServer.exe",
      "args": ["--server", "localhost", "--database", "SqlNexus", "--trusted-connection", "true"]
    }
  }
}
Then start the server, open Copilot Chat (Ctrl+Shift+I), switch to the
SQL Nexus Diagnostic Agent, and ask your question.
All MCP tools are read-only and run against the already-imported diagnostic database — never against a live or production SQL Server.
AI-generated content notice — the agent's analysis is AI-assisted and may be incomplete or inaccurate. Validate every finding against the underlying SQL Nexus tables before acting on it. See the Transparency Note.
For the full step-by-step walkthrough, Copilot CLI setup, the complete tool list, the
two-database comparison workflow (compare_nexus_databases), example prompts and troubleshooting,
see AI Assisted Analysis.
Look at SQL LogScout.